About the UK Water Resources Portal
The UK Water Resources Portal is an interactive tool to monitor the UK hydrological situation in (near) real-time at a range of spatial scales and across a range of hydrological variables. It helps users understand the current water resources conditions, track drought development, and compare conditions across different parts of the UK.
The Portal brings together rainfall, river flow, soil moisture and groundwater level data in one place, including real-time river flow data from the Environment Agency and the Scottish Environmental Protection Agency as well as COSMOS-UK soil moisture data.
Data are available in their raw, observed format (e.g. millimetres for rainfall, metres cubed per second for river flows etc.) and standardised drought indices. The table below summarises what data are available in the Portal.
More information about the UK Water Resources Portal and how it was developed can be found in this open access paper (Barker et al., 2022).
Find out more about:
Important notes
River flows
- Daily river flow data are available on a real-time basis for over 900 catchments in England and Scotland using the Environment Agency's hydrology data API and the Scottish Environmental Protection Agency's live data API. This means that daily flows are available in real-time (within ~2 days).
- Daily river flows for Wales and Northern Ireland are updated each month through the National Hydrological Monitoring Programme and the Hydrological Summary for the UK and are provided by Natural Resources Wales and the Department of Infrastructure - Rivers in Northern Ireland.
- Daily river flow data are shown as a solid black line for checked data and a dashed line for unchecked data.
- Recent observations may be revised following quality assurance checks or updates from data providers and unchecked data may be erroneous and all data should be assumed to be provisional and should not be directly used for decision-making purposes.
Rainfall
- Areal estimates of rainfall are based on a relatively sparse network and may yield different areal averages to results from higher density networks used by the environmental regulators/measuring agencies.
- Data from the HadUK-Grid dataset used for rainfall calculations is version 1.3.2.ceda for the period 1836-2025 (monthly data) and 1891-2025 (daily data).
- Data from 2026 onwards uses provisional HadUK data supplied by the Met Office to UKCEH under an Open Government License. Met Office; Hollis, D., McCarthy, M., Kendon, M., Legg, T., Simpson, I. (2018). HadUK-Grid gridded and regional average climate observations for the UK. Centre for Environmental Data Analysis, February 2025.
- Provisional data are based on observations available to the Met Office at time of production and may be subject to change.
Soil moisture
- Soil moisture data are only presented in their raw form, i.e. as volumetric water content expressed as a percentage.
- Due to the short data records of COSMOS-UK sites, soil moisture regime bandings have been derived using a modelled data and are therefore less reliable than equivalent bandings of river flows and groundwater levels (which are based on historic observed data for each site).
- The COSMOS-UK website displays a wide range of hydrometeorological and soil variables, and a soil moisture index based on inferred wet and dry reference values.
Groundwater levels
- BGS groundwater level data provided by the Environment Agency (for England), Natural Resources Wales, the Scottish Environmental Protection Agency and Department of Infrastructure - Rivers in Northern Ireland.
Graphs
- You can view up to four graphs at a time — if you change the data type, time scale or standardised index accumulation period, the graphs will also update if the data are available. If data aren't available, the graph will blank.
- Not all graph types are available for all data types — if you select a graph type and data type which aren't available for a particular site an error message will appear explaining this.
Data available in the UK Water Resources Portal
| Dataset shown on the Portal | Data range | Spatial scale | Temporal scale | Raw data unit | Drought available |
|---|---|---|---|---|---|
| Rainfall | Daily data 1891 – present
Monthly data 1836 – present |
1km grid*, gauging station catchments and hydrological units | Daily and/or monthly | mm (where available) | Standardised Precipitation Index (SPI) |
| Climatic water balance | 1884 – present | 1km grid, gauging station catchments and hydrological units | Monthly | Not shown as raw data | Standardised Precipitation Evapotranspiration Index (SPEI) |
| River flows | Start of the record for each individual site – present | Gauging station catchments | Daily and monthly | m3/s | Standardised Streamflow Index (SSI) |
| Soil moisture | Start of the record for each individual site – present | COSMOS-UK sites | Daily and monthly | Volumetric water content (%) | Not currently available |
| Groundwater levels | Start of the record for each individual site – present | Boreholes | Daily and monthly (site dependent) | Metres above ordnance datum (maod) | Standardised Groundwater Index (SGI) |
* Note that 1km rainfall grids are only available for monthly rainfall (mm) and the Standardised Precipitation Index (SPI)
What are 'normal' conditions: data visualisation
When viewing the Raw data tab, current and past conditions are shown on the map and graphs relative to what is considered 'normal' for each location.
Normal conditions are defined separately for each catchment, river gauge, groundwater borehole or soil moisture site using the historical record available for that location (note that due to the short records at COSMOS-UK sites, soil moisture 'normal' is defined using modelled data). This means conditions are assessed against what would typically be expected at that site for the time of year.
Most observations are expected to fall within the normal range, while values in the highest and lowest categories represent unusually wet or dry conditions that occur less frequently.
To do this, historical observations for the same day or month are ranked and converted into percentiles. These percentiles are then used to assign the categories shown on the map and graphs, ranging from exceptionally low to exceptionally high conditions, using the percentile ranges in the table. For daily rainfall, values represent the cumulative rainfall received since the beginning of the month.
Because the classification is relative to local conditions, users can compare how unusual current conditions are across different parts of the UK, even where average rainfall, river flows or groundwater levels differ substantially.
| Category | Percentile range | |
|---|---|---|
| Exceptionally high | > 95 | |
| Notably high | 87–95 | |
| Above normal | 72–87 | |
| Normal range | 28–72 | |
| Below normal | 13–28 | |
| Notably low | 5–13 | |
| Exceptionally low | < 5 |
Regime band methodology courtesy of Environment Agency. Contains Environment Agency information © Environment Agency and/or database right.
Additional background layers
Two background layers are provided in addition to light, satellite or street maps:
- Land Cover Map 2024 at 10-metre resolution. The map presents the land surface classified into 21 UKCEH land cover classes, based upon Biodiversity Action Plan broad habitats.
- Hydrogeology 625K digital hydrogeological map of the UK. A hydrogeological map at 1:625k -scale which can be used as a guide to aquifer characteristics at a regional or national level.
Downloading data
- Raw rainfall data is available from the Met Office via the Centre for Environmental Data Analysis Archive
- Raw river flow data can be downloaded from the National River Flow Archive
- COSMOS-UK soil moisture data is available to download from the Environmental Information Data Centre
- Raw groundwater level data is available from the British Geological Survey
- We anticipate that drought indices will be available to download from the Environmental Information Data Centre in autumn/winter 2026.
- SPI, SSI and SGI data are available to download for individual catchments or sites from the map layer menu or individual graphs — see below.
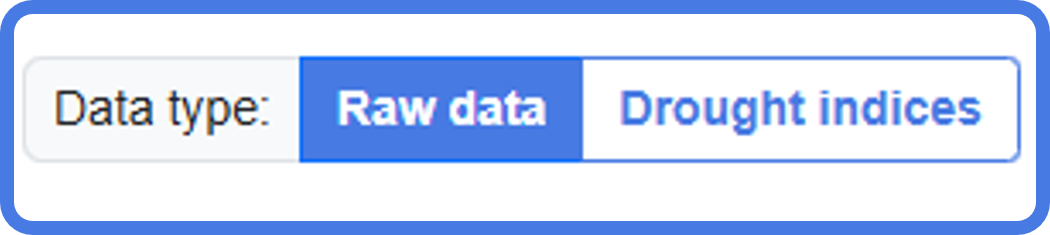
- Select the Drought indices tab
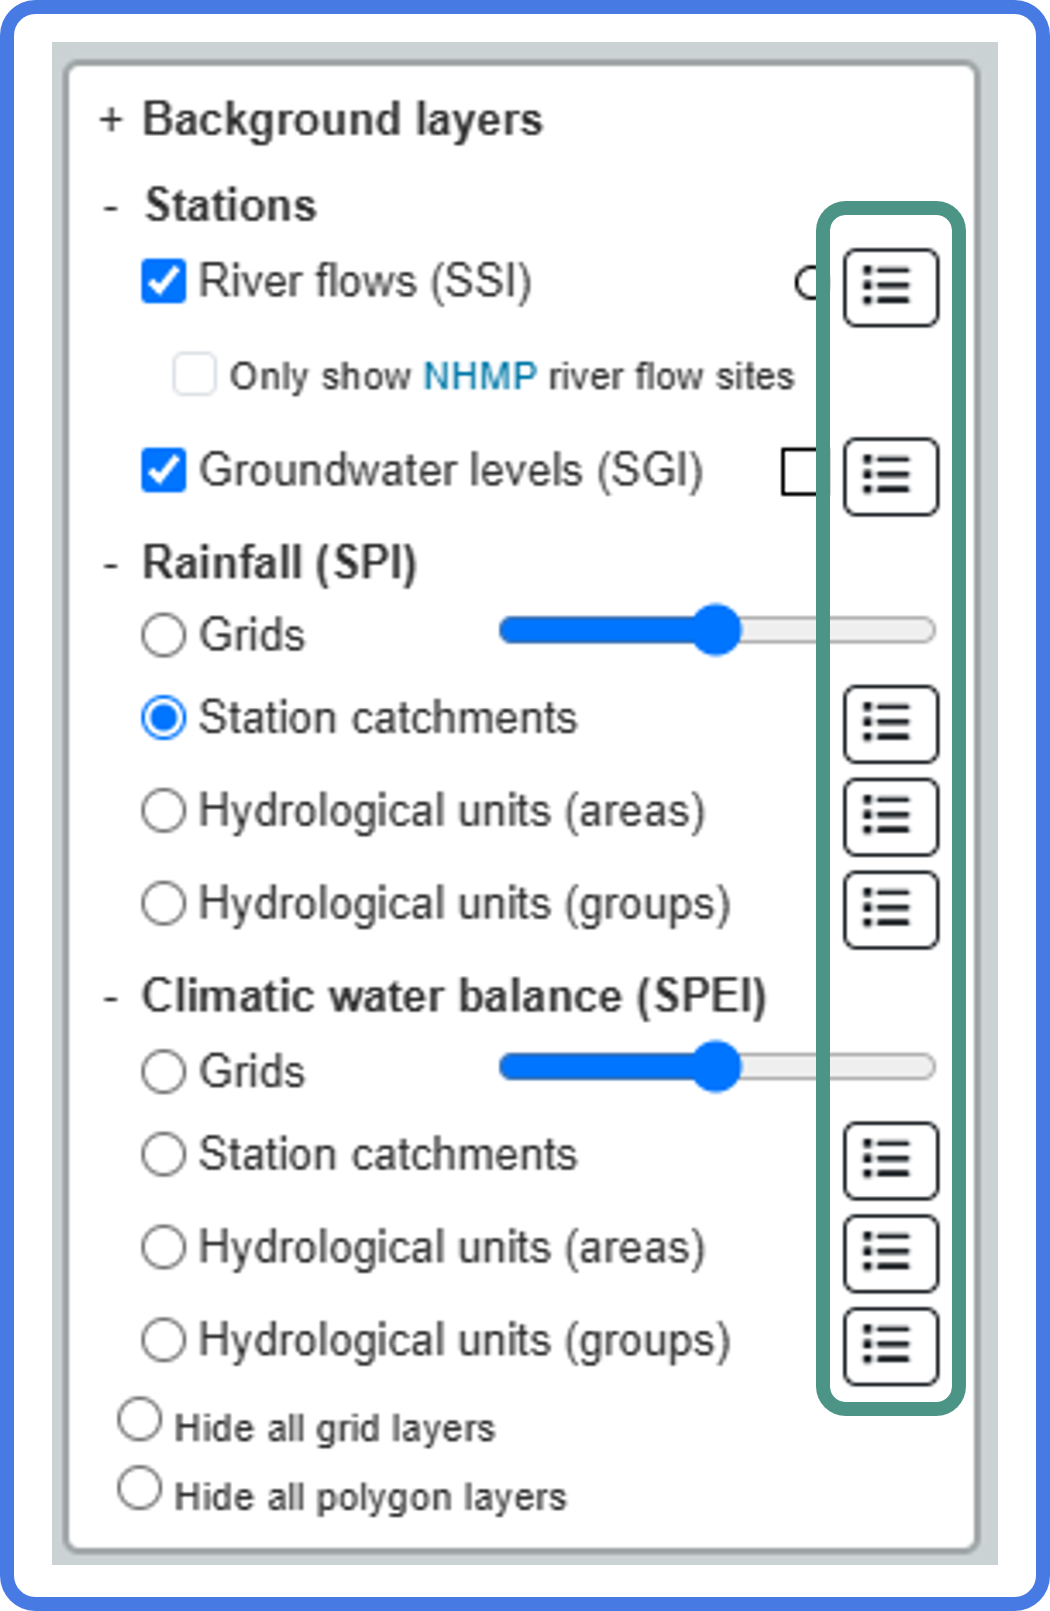
- For your chosen variable, open the list of catchments/sites.
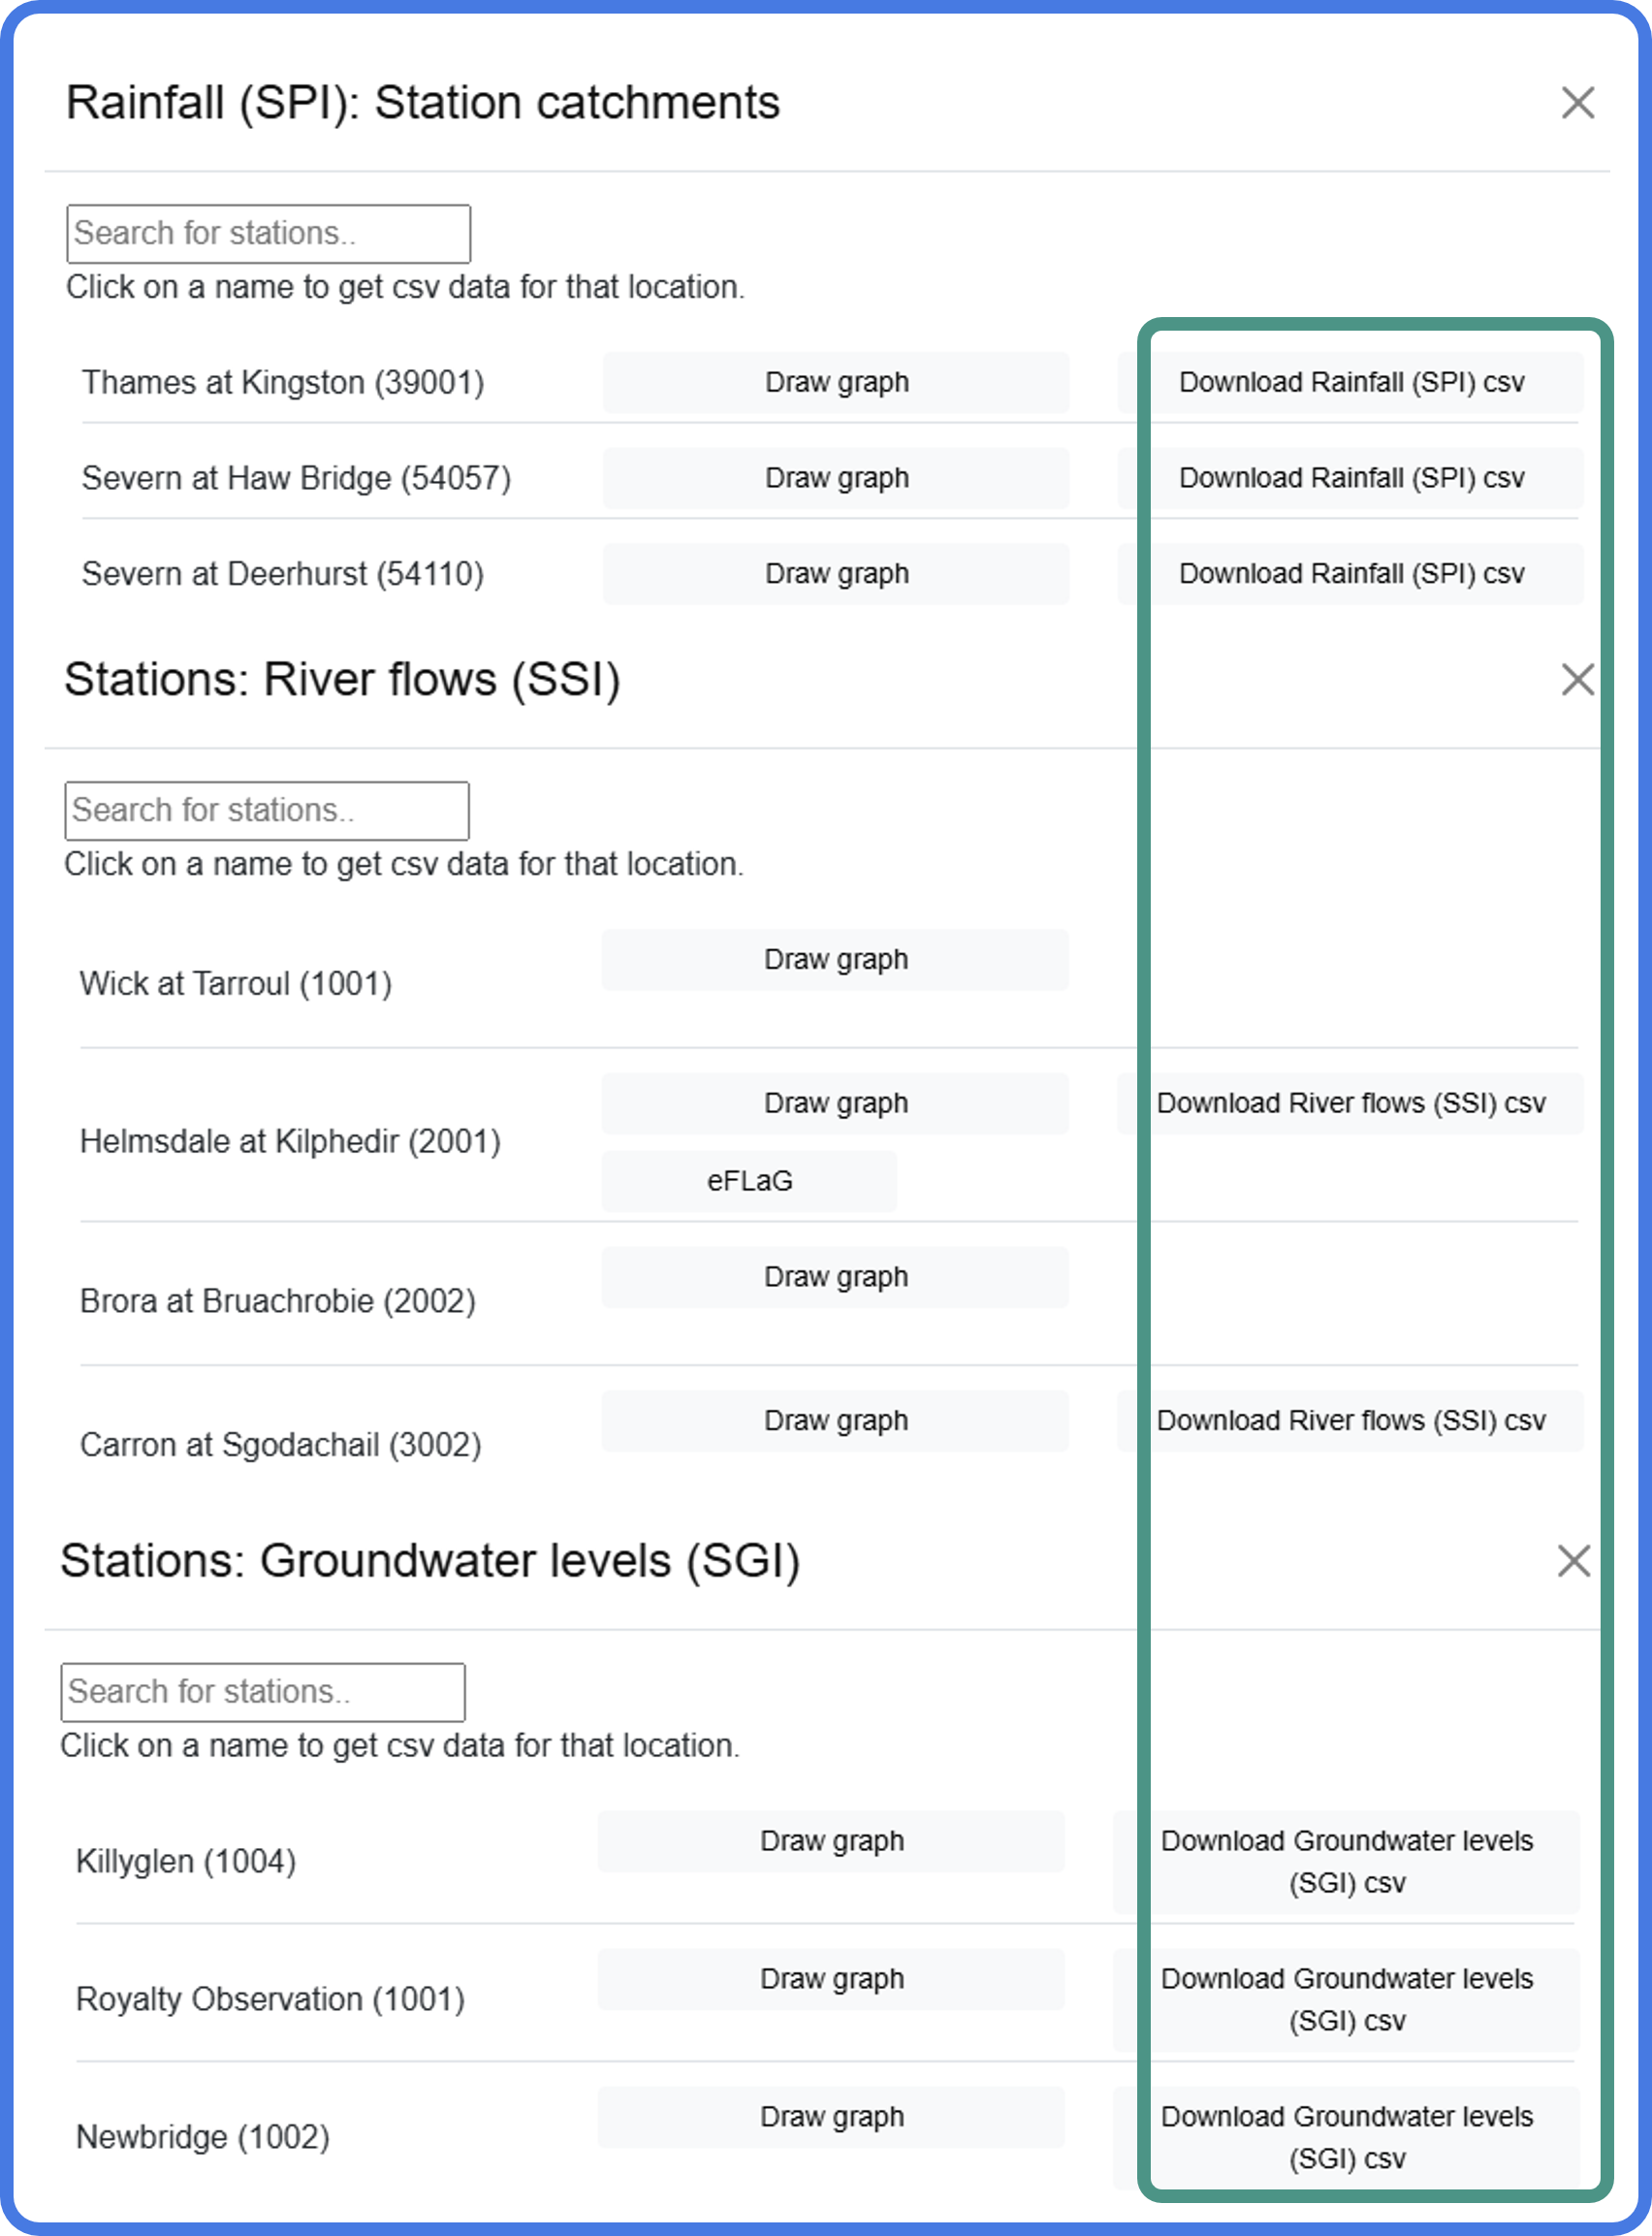
- Click download csv for your selected site, use the search box to filter the list by river, gauging station or borehole name.
N.B. SSI only available for catchments with > 25 years data.
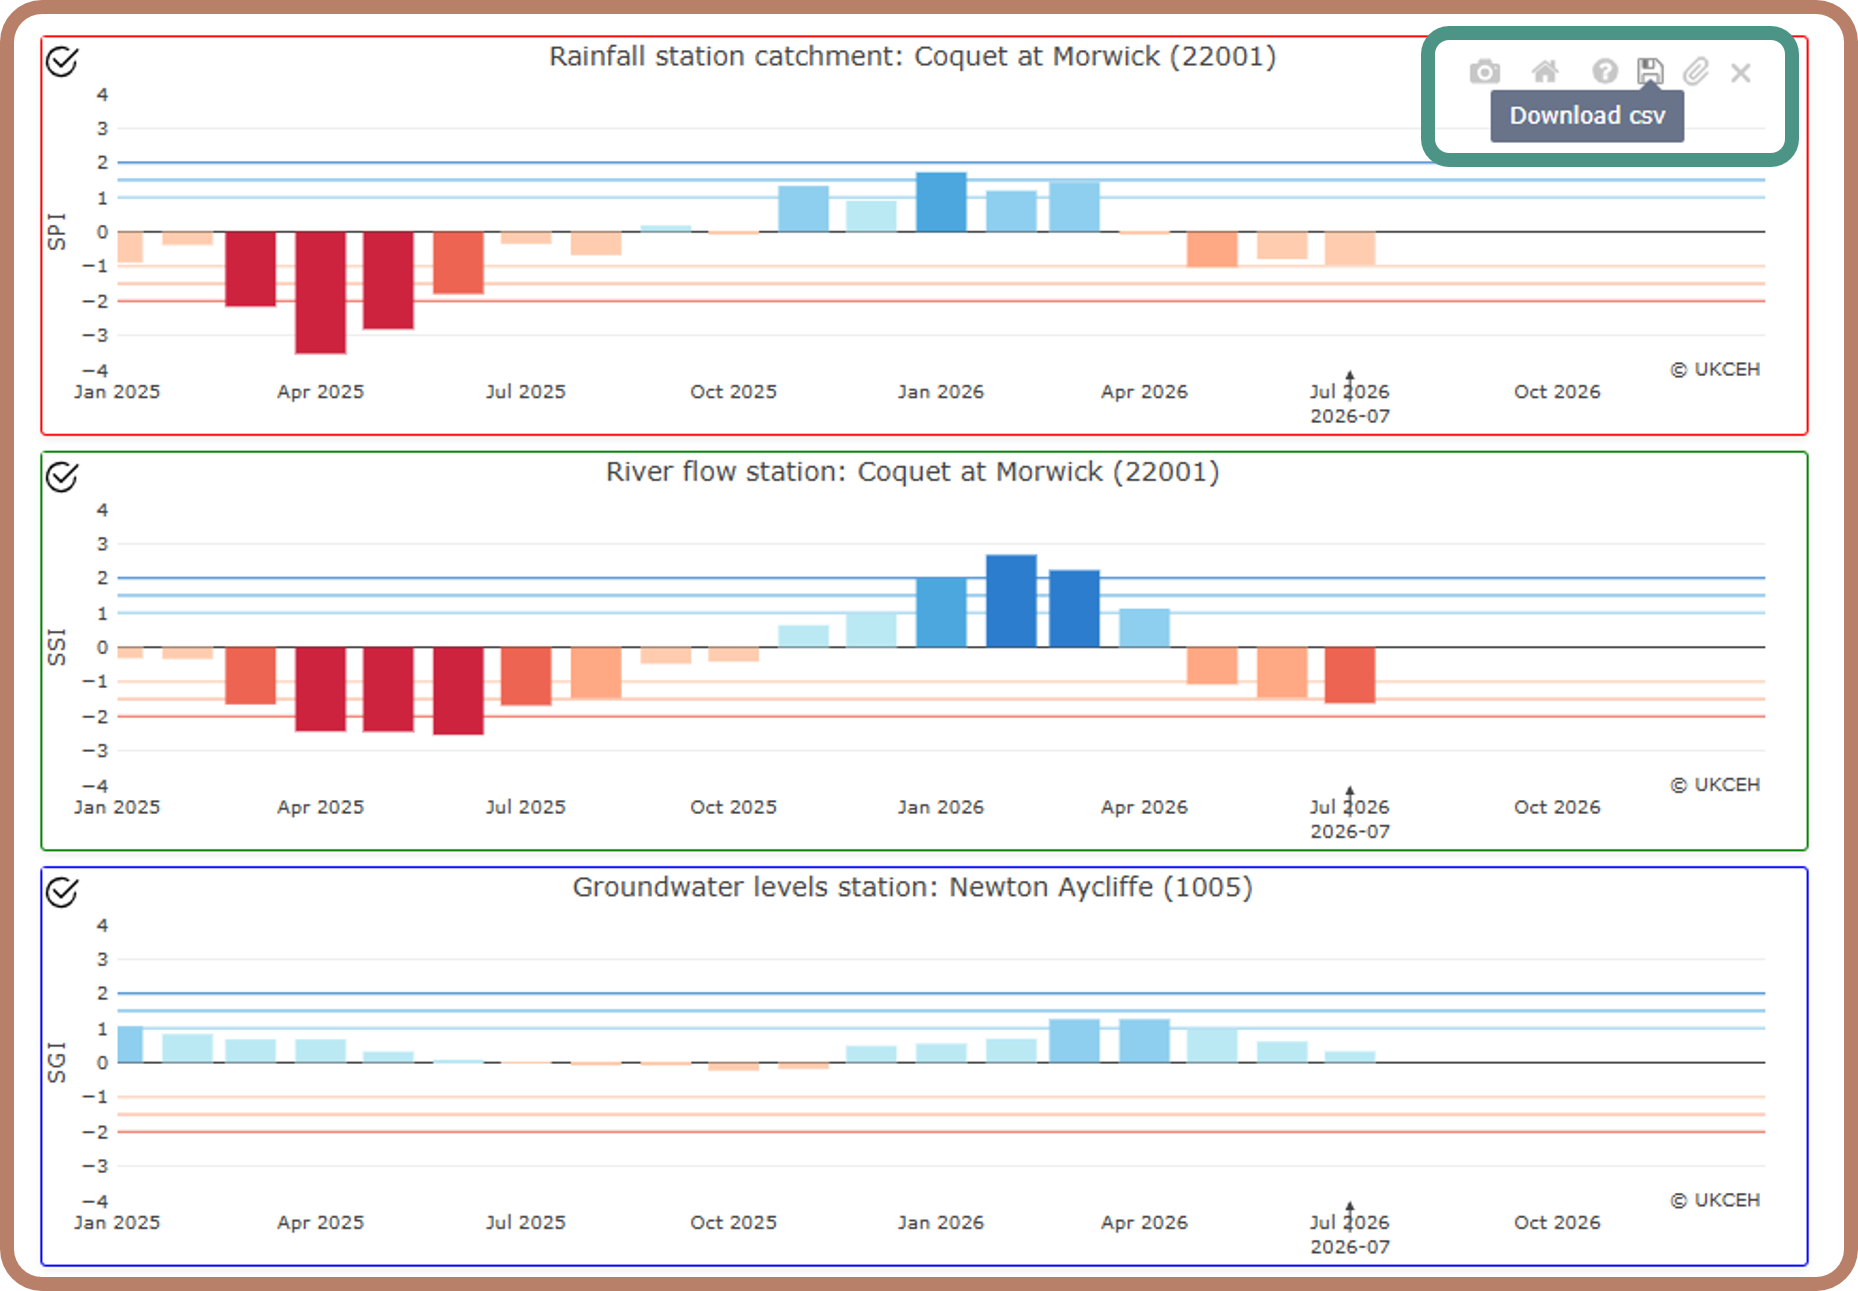
Download indices data can also be downloaded directly from each plotted time series using the download csv button.
More information about the UK Water Resources Portal
For more information on major flood and drought events see the occasional reports of the National Hydrological Monitoring Programme.
If you would like to submit feedback about the UK Water Resources Portal, please send it to nhmp@ceh.ac.uk.
We plan to add the following datasets/types to the UK Water Resources Portal in the future:
- Gridded soil moisture
- Vegetation indices, such as the Vegetation Health Index
Find out more about the history of the UK Water Resources Portal, and its development and co-design with a range of stakeholders in an open access paper (Barker et al., 2022).
Acknowledgements
The UK Water Resources Portal is supported by the Natural Environment Research Council award number NE /Y006208/1 as part of the NC-UK programme delivering National Capability. The UK Water Resources Portal was primarily developed in the ENDOWS project Engaging diverse stakeholders and publics with outputs from the UK Drought and Water Scarcity Programme), funded by the Natural Environment Research Council award number NE/L01016X/1 and Drought Impacts: Vulnerability thresholds in monitoring and Early-warning Research (DrIVER) award number NE/L010038/1. Additional funding to develop the Portal was provided by the Natural Environment Research Council award number NE/R016429/1 as part of the UK-SCAPE programme delivering National Capability.
NRFA river flow and BGS groundwater level data provided by the Environment Agency (for England), Natural Resources Wales, the Scottish Environmental Protection Agency and Department of Infrastructure - Rivers in Northern Ireland.
References
Barker, L J, Hannaford, J, Chiverton, A, and Svensson, C. From meteorological to hydrological drought using standardised indicators, Hydrology and Earth System Sciences, 20, 2483–2505, 2016.
Barker, L J, Fry, M, Hannaford, J, Nash, G, Tanguy, M, Swain, O. 2022. Dynamic high-resolution hydrological status monitoring in real time: The UK Water Resources Portal, Frontiers in Environmental Science - Interdisciplinary Climate Studies.